About Mollier Diagram Pro software
Mollier diagram Pro is a powerfull application based on the H-S diagram or Mollier diagram. The application can be used to make calculations of air treatment processess such as heating, cooling and humidifying. The output of these calculations is conviniently stored in a spreadsheets which can be exported to Microsoft Excel.
More information about Mollier Diagram in German or Spanish:
Key features of Mollier diagram Pro
- Automatic enthalpy calculation
- Available in English, German and Dutch
- Easy input of data, simply by clicking on the wanted points in the diagram
- Supported temperature range of -25 °C to 200 °C
- Select heights ranging from 0m to 2490m
- Project names and other data are easily filled into the Excel spreadsheet module
- Air units calculations for heating, cooling and humidifying
- Twincoil models, heatwheel models, crosflow models
- Possibility to mix different 'buckets'of air
- Heatpump models
- High Resolution printing
- Input altitude and air Pressure
- Temperature resolution of 0.1 °C and RH resolution of 1%
Screenshots of Mollier diagram Pro in different use cases

Examples of use cases Mollier diagram
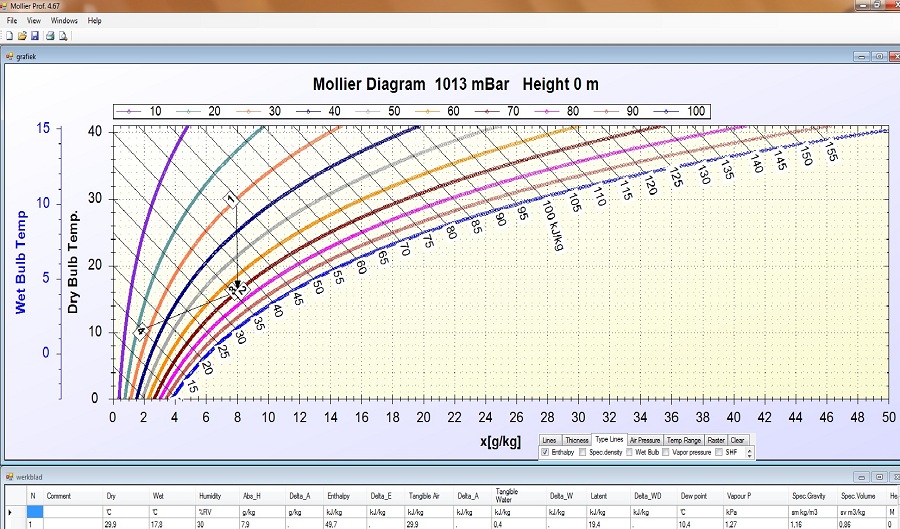
Heating air
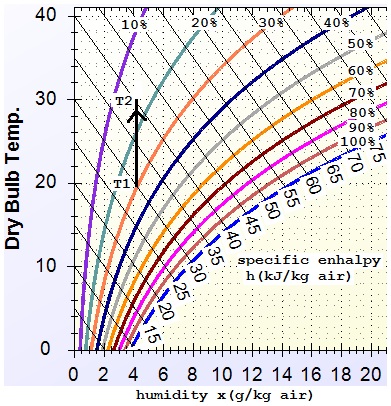
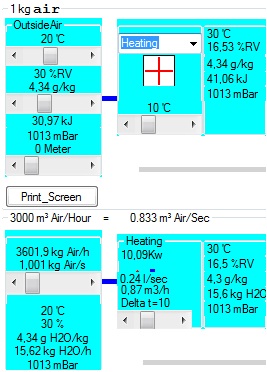
If you need to heat 1kg air = 0,883 m3 from 20 °C to 30 °C. Than you need:(40 kj/kg -30 kj/kg) * 1 kg Air = 10 kj of energy. If you want heat 0,883m3/s air from 20 °C to 30 °C with an air heater than the capacity = 10kW. Look that de absolute humidity is not changing. There is still 4 g/kg moisture in the air only
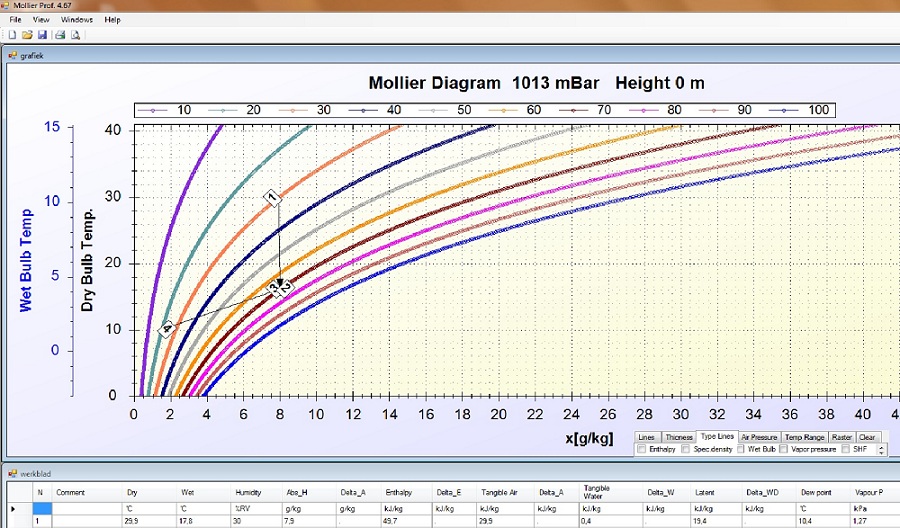
Humidifier
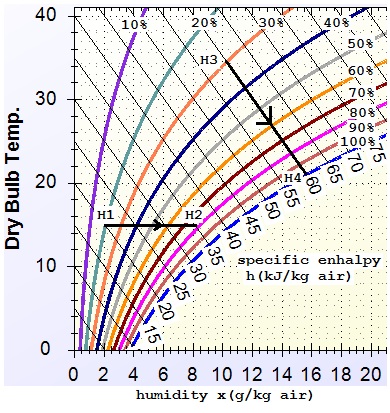
If you Humidify Air with Steam from H1 to H2 .Then you bring (8g/kg-2g/kg)= 6g moisture into the air. Note that the relative humidity is also changing from 20% to 76%. If you humidify air with spray water from H3 to H4. Then you bring (15, 6-10) = 5,6g moisture into the air. The costs of evaporation heat to vapor water to vapor form. That's the reason the temperature is getting lower from 35 °C to 22 °C. You can practicaly apply this on a hot summer day by spraying water on the roof of you house and through this cool your house. If you bring more spray water into the air then the air can't hold it because the air is already humidified upto 100% and you have reached the boundary. Then the water begins to drop down as condensed liquid water.
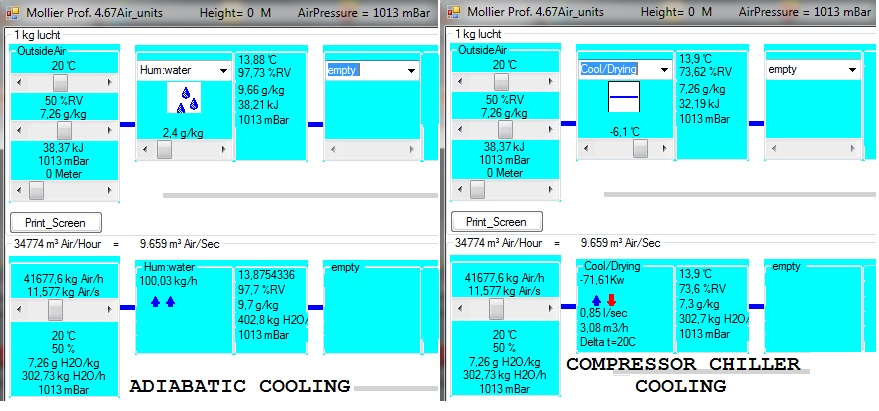
Comparing efficiency of cooling methods - adiabatic cooling vs. compression chiller cooling
With Program Mollier you can easily compare two ways of cooling. For example one can compare a modern cooling method such
as adiabatic cooling with compression chiller cooling.
The performance of the two cooling methods is easily compared with Mollier diagram Pro. The resulting models of adiabatic cooling and compression chiller cooling
are presented in the overview below.
The high pressure water mist can open space to serve the
adiabatic air cooling.
There may be a drop in temperature to be achieved from about 10 °C, and this can, for example, be achieved with a heat exchanger or a heat wheel.
In some cases, the adiabatic cooling of the mechanical cooling or take unnecessary to changing weather conditions in spring or autumn.
Each kilogram of water that evaporates into the air adiabatically,
has a cooling capacity of 640 W. In other words, a system with a cooling capcity of 100 liters per hour has an energy need of 64 kWh.
The pump consumes about 4 watts per kg of water. to this
cooling effect to obtain, there is no special treatment for
the water.
Moreover, high pressure systems are much more efficient than low pressure systems.